Data integration helping firms track carbon emissions
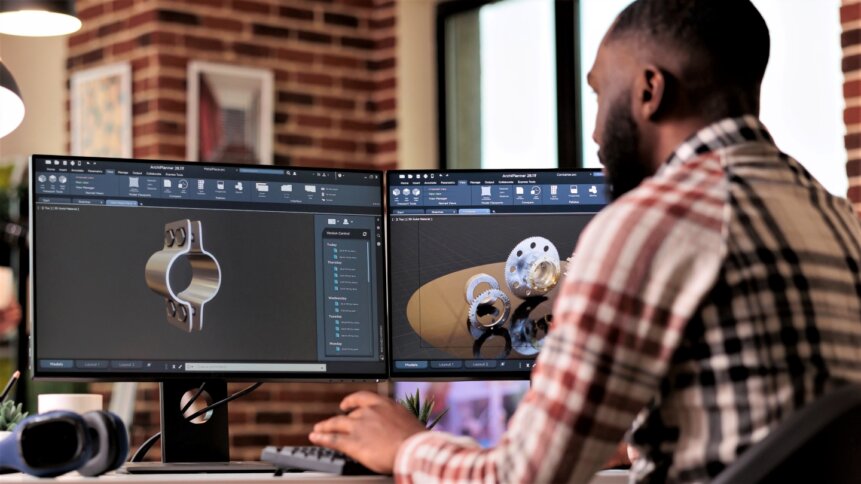
Clean tech considerations: feeding environmental data into mainstream software enables designers to make greener products. Image credit: Shutterstock.
It may be too early to call it a trend, but carbon emissions data is – in some cases at least – bringing new environmentally aware features to popular commercial software. There are a growing number of big-name apps and software packages that provide users with useful carbon emissions data rolled into familiar tools.
This month, Sage – a provider of accounting, financial, HR and payroll technology – announced that it had acquired Spherics to help its customers measure and cut their carbon emissions. Spherics, based in Bristol, UK, brings expertise in generating carbon emissions data for firms based on their accounting records. The green tech company enables users to readily visualize the impact of procurement categories such as delivery, accommodation, electricity, and travel.
Collaborative climate action
“By combining Spherics’ innovative software with Sage’s digital network, we are connecting businesses with their customer and supplier emissions data, enabling easy and collaborative climate action across value chains which helps to reduce carbon,” commented Amaya Souarez, a senior member of Sage’s Cloud Operations team. Solutions such as Spherics’ carbon emission data integration add a useful, environmentally focused business intelligence feed to company dashboards.

Initiatives such as Tech Zero – a climate action group for tech companies – are seeing more firms pledge to ‘annually measure and publish all scope 1, 2, and 3 greenhouse case emissions’. And having carbon emissions data to hand, baked into popular software tools, makes reporting on the environmental impact of business activities much less of a headache for firms. Also, it’s a feature that lends itself to a range of customer-friendly activities.
You can picture easy-to-access carbon emissions data being used on product labeling, allowing businesses to better inform their customers. For those who have invested in reducing their carbon footprint, the data makes it easy for management teams to check progress, and communicate their success stories to clients. As we’re beginning to see with services such as running applications in the cloud, customers are starting to shop for data centers and cloud compute based on the environmental performance of facilities.
Automatic energy profile tracking
Being able to track the energy profile of not just data centers, but all types of buildings has – thanks to big data – become significantly more straightforward. Dubbed AutoBEM and developed by researchers at the Department of Energy’s Oak Ridge National Laboratory (ORNL) in the US, the automatic building energy modeling tool boasts impressive features. Specifically, the package ingests satellite imagery, street views, and other publicly available data to determine a building’s size and energy profile.
Features that can be extracted (using high-performance computing) from the raw data include the number of windows, floors, building envelope materials, roof type, as well as heating, ventilation, and cooling systems. And these are used to not just build an energy model for each building, but also to suggest energy-saving improvements. Recommendations include whether there’s scope for installing solar panels, heat pumps, smart thermostats, or energy-efficient water heaters – to give a few examples.
The power of this data soon becomes apparent when you consider, as the ORNL team highlights, that buildings account for 40% of America’s energy consumption and 75% of its electricity. Being able to automatically profile every one of the 129 million buildings in the US – which AutoBEM has enabled – gives the country sharper insight into its progress towards net-zero carbon emission by 2050. And again, this data can be conveniently rolled into popular software to accelerate the process.
Data insight up for grabs
Google has added the data to its Environmental Insights Explorer – a web app that requires sign-up, but is free to use and shows greenhouse gas reduction opportunities across cities. Lightbox, a data platform, is using AutoBEM to estimate long-term energy and operating costs for buildings. According the firm, customers include real estate investors, brokers, lenders and banks, appraisers, engineers, and environmental consulting firms.

Take up for the AutoBEM data feed has been beyond the initial expectations of the researchers. This observation adds weight to the notion that carbon emissions data, and other environmental markers, are increasingly in demand from software developers. “The biggest surprise has been the amount of interest from companies and the array of data modeling or analysis they request,” said Joshua New, who leads the ORNL-based AutoBEM project.
Digital twin software provider Bentley Systems is another developer that plans to use the data in updates to its products. City-scale digital twins give users the chance to try a wide range of ‘what if’ scenarios to optimize building design and identify practical strategies for decarbonization. There are other examples too of bringing carbon emissions data to popular industrial software.
Just last month, industry giant Siemens announced that it had teamed up with sustamize – an environmental database firm – to bring carbon emissions data to Siemens digital transformation platform dubbed Xcelerator. “Today, it is thought that 80 percent of the environmental impact associated with a product can be avoided in the development and design phase,” said Eryn Devola, VP of Sustainability at Siemens Digital Industries Software. “Our collaboration with sustamize will enable customers to understand the environmental impacts of their products and processes early in the product development based on comprehensive, up-to-date, data.”

5 March 2024