Transponder data ships supply chain insight on API voyage
Intelligence report: there’s information to be found everywhere as long as you know where to look. Image credit: Shutterstock
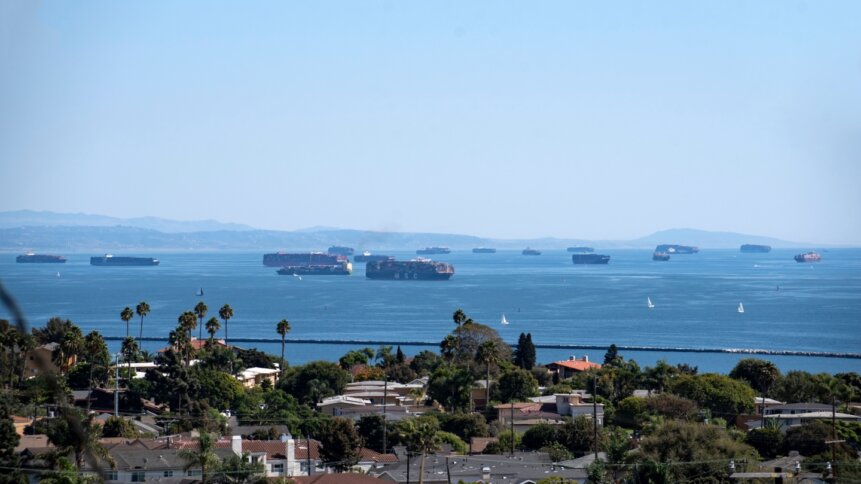
Picking up a pair of binoculars and counting the number of container ships waiting to dock is one way of eyeballing global supply chain developments, but there are digital options too. Vessel tracking websites have made gathering insights on shipping activity as simple as zooming in on the region of interest and applying a few clicks of the mouse, trackpad, or touchscreen. Powering these insights is the availability of automated identification systems (AIS) data over the web. Ships fitted with transceivers can be tracked by so-called AIS base stations on the ground, as well as suitably equipped satellites orbiting high above, to provide information such as the vessel’s identifier code, current position, heading, and speed.
Real-time APIs
What’s more, the availability of real-time APIs opens the door to tech firms looking to build their own custom analytics to gain awareness of the topics that interest them – for example, by logging vessel waiting times at major supply chain hubs to make inferences about the current status of global supply chains. Input data can be supplied in native or human-readable forms, and marked up according to popular data exchange formats such as JSON, XML or CSV.

Data records available via websites such as VesselFinder, and others, include the updated positions of hundreds of thousands of vessels every day, as well as detailed voyage histories. Typically, users can upload photos to add to a crowdsourced database of images that matches ship IDs to visual records. In many cases, information is also provided on the type of vessel and its dimensions, which provide clues to its activity and carrying capacity.
AIS data, which is transmitted natively over very high frequency (VHF) radio and updates as frequently as every couple of seconds, was originally devised for applications such as ship identification and to aid collision avoidance. But now, being readily available over the web, dynamic AIS records are a treasure trove for data scientists who have grabbed the resource with both hands to pore over trends in global shipping.
Container firms and vessel operators too, have been making use of AIS information – together with other data streams – for many years to inform activities such as predictive maintenance of their assets. There are newer applications as well that feed into reporting needs moving higher up on the agenda, such as being able to track carbon emissions. Accurate carbon footprint calculations are a big talking point currently as the EU sails closer to applying its cap-and-trade scheme to European shipping.
Adding to the mix
There’s other data too that be harnessed to remotely shine a light on what’s happening at key nodes in supply chains enabled by international shipping. In May, Quantcube, a French firm whose strategic partners include the European Space Agency, showed how it could use nitrogen dioxide (NO2) levels to examine the effects of lockdown conditions on port activity in the city of Shanghai – a major hub in the supply of electronic components. NO2 concentrations are associated with the combustion of fossil fuels, which can make the numbers a useful proxy for industrial activity. And, in its analysis, the team found that while levels of NO2 pollution were uncharacteristically low across the region, there were blobs of higher concentrations around ports. The result suggested that docking operations had been allowed to continue, despite restrictions in place elsewhere, to safeguard economic activity.

Interestingly – in a follow-up study – Quantcube’s analysts discovered that while the port activity persisted, other industrial operations appeared to be struggling to restart after lockdown conditions were eased at the beginning of June. The finding was in contrast with the ‘business as usual message’ from Chinese state media and shows how clever use of shipping and other industrial markers could provide valuable intelligence for companies as they look to diversify their suppliers and add resilience.
First movers
In some cases, suppliers have been the first ones to move, diversifying their own operations by opening hubs overseas. A recent example is Apple supplier Pegatron, which assembles iPhones, and is reportedly firming up manufacturing plans in Vietnam. The country is emerging as an important alternative hub for the production of electronics with Chinese companies such as Luxshare Precision Industry and Goertek (both involved in making Apple products) also having a presence in Vietnam.
But it’s important to note that the backdrop to these supplier movements is more complex still with activities having to factor-in not just the industrial stop-start of supply chain hubs in mainland China, but also rising political tensions in Taiwan. And while data can’t help us return to a more simpler life, it can provide a healthy sense-check for the difficult business decisions that tomorrow is likely to bring.

5 March 2024